A review of machine learning techniques for predicting patient outcomes from whole slide images.
Machine learning algorithms for histopathology images are becoming increasingly complex. From detecting and classifying cells and tissue to predicting biomarkers and patient outcomes. Simpler tasks rely upon pathologists’ annotations of specific features in the tissue. But biomarkers and outcomes are more complex. Algorithms must decipher large whole slide images without any prior knowledge of which regions of tissue or characteristics of its appearance are important.
Risk stratification can already be done using cancer staging, molecular features, or clinical variables. However, improving prognostic insights is an active area of research. Prognostics refers to the likely outcome for a patient following the standard treatment - for example, the likelihood that a patient’s tumor will recur, that a distant metastasis will occur, or that they will die.
Regardless of the target, the challenges in creating such an algorithm are similar. H&E whole slide images are large, and tissue appearance is diverse. Unlike methods to find mitoses or segment tissue types, pathologists cannot annotate which regions of the tissue are associated with patient outcome - at least not with any high degree of certainty.
Tumor grading assigns a measure of cellular appearance, but is not always a good measure of prognosis. Pathologists’ observations of grade also come with a high inter-observer variability.
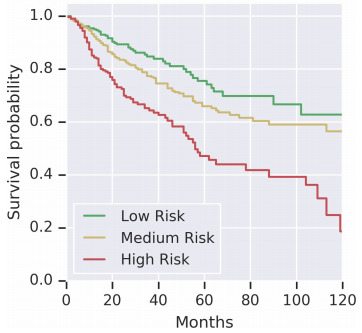
The goal of outcome prediction models is to stratify patients by risk. This article will outline the key components of an outcome prediction model for histopathology images using deep learning. I’ll outline strategies for selecting image patches to model, loss function options for survival model optimization, techniques for aggregating image patches to form a prediction for a whole slide, and some interesting model extensions.
Selecting Image Patches
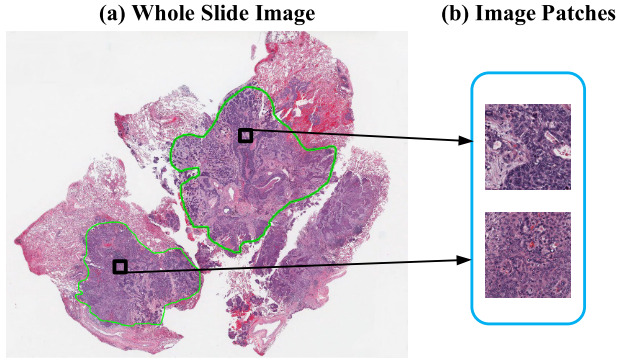
The first challenge in training a deep learning model on gigapixel whole slide images is that the images are too large to fit on the GPU, making end-to-end training impossible. Patient-level survival times apply to the whole slide (or multiple slides). While a pathologist can annotate tumor regions within the slide, they cannot identify exactly which patches are informative for the model - that’s the job of the model. Some studies have a pathologist annotate tumor regions and the deep learning model uses only those. Others train a CNN model to distinguish tumor from non-tumor and then use only the tumor regions for the survival model. Yet others include all tissue regions in the model. This section outlines these strategies.
Random Patches
Zhu et al. had a pathologist annotate image regions within each tumor. They then randomly sampled one large patch from each ROI and trained a CNN survival model [Zhu2016]. Wulczyn et al. also sampled patches randomly to train their model [Wulczyn2020].
Predictive Patches
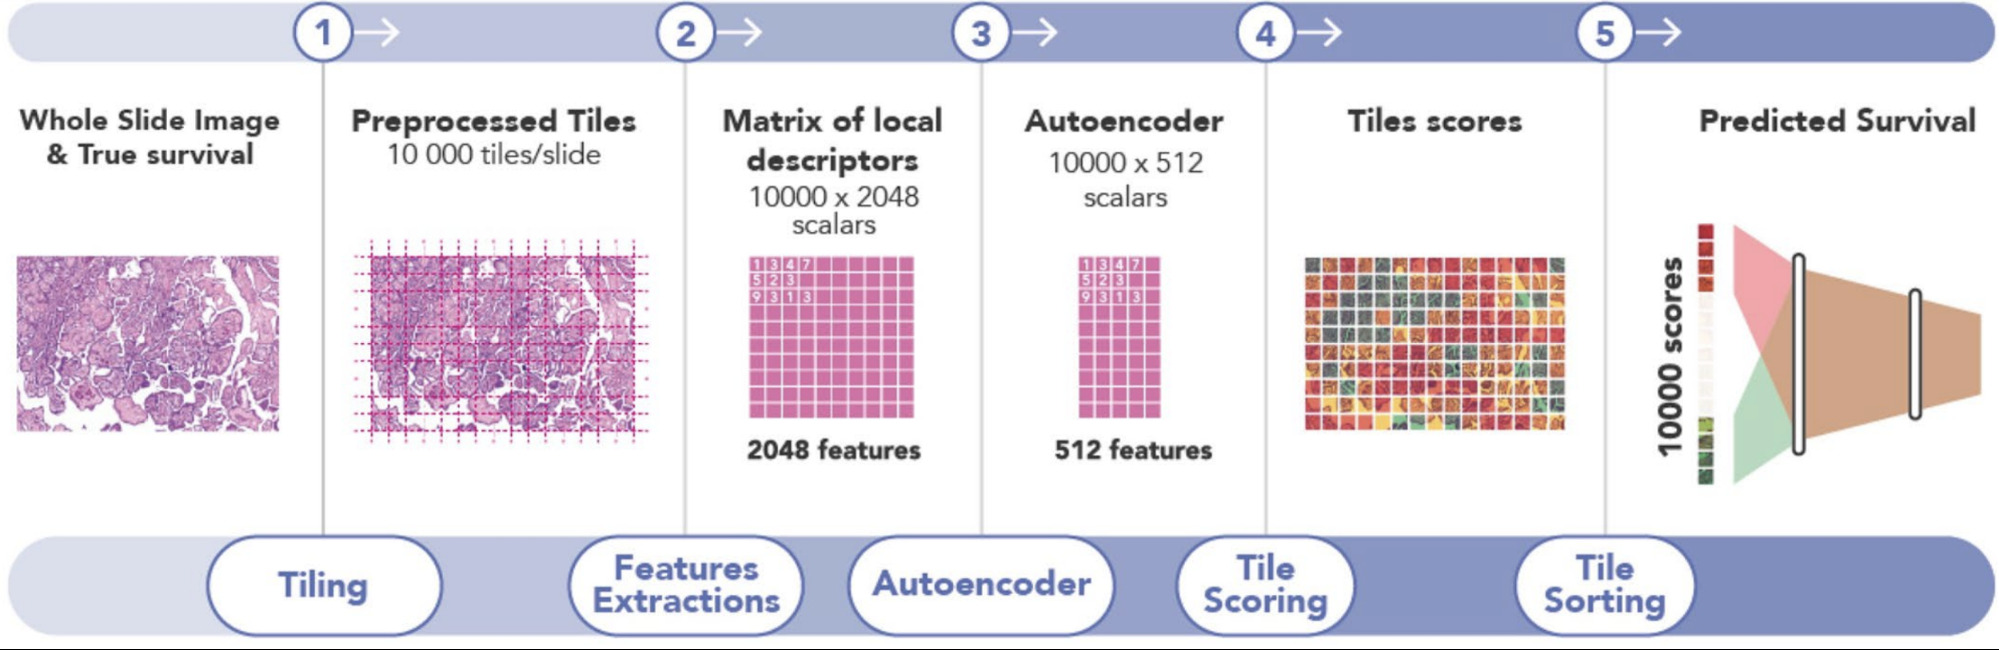
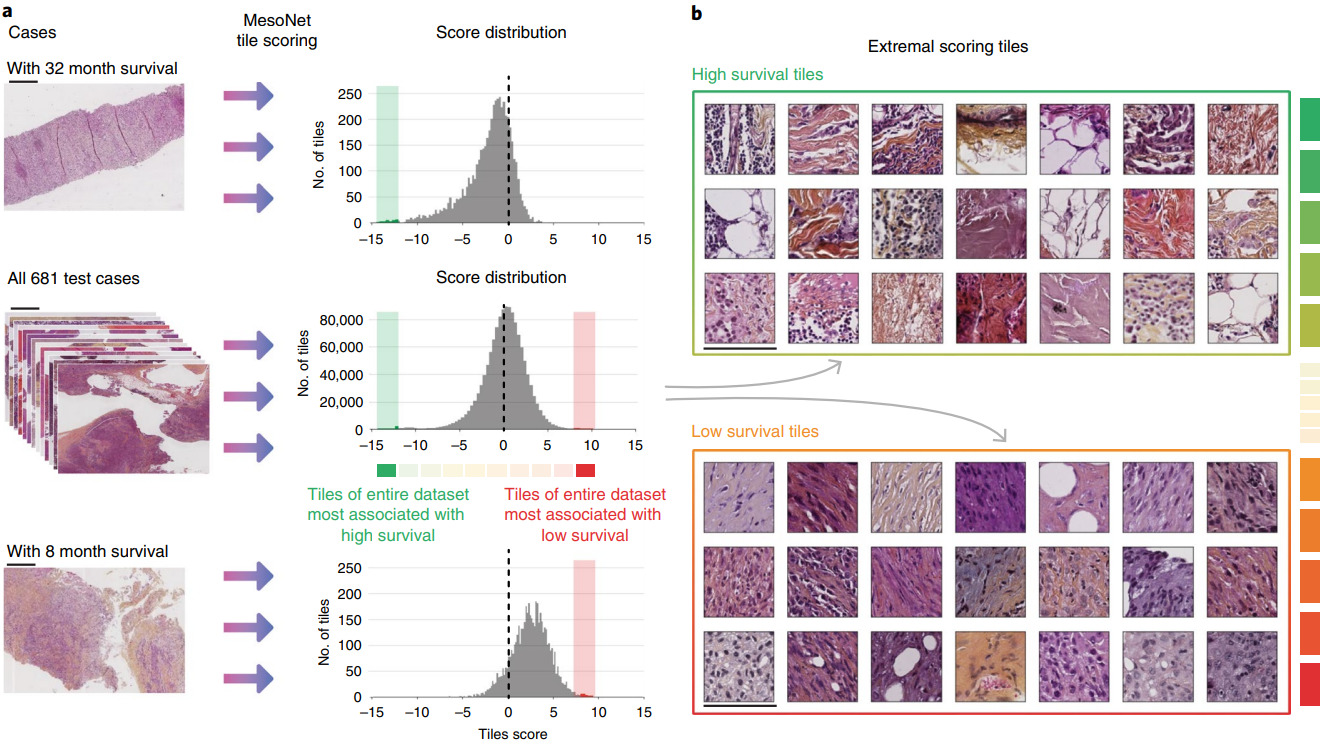
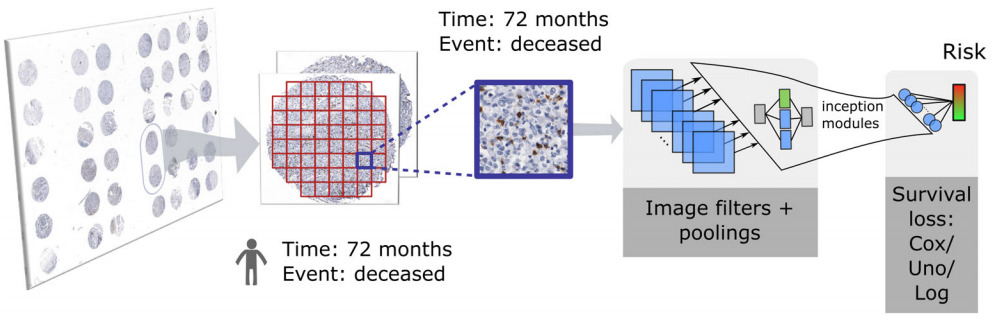
Instead of a random sample of patches, other methods identify the most predictive ones. Courtiol et al. trained a CNN to predict risk for every image patch [Courtiol2019]. The model then selected the highest and lowest scoring patches for each patient to train the final survival model.
Examining the highest and lowest survival patches was particularly insightful. Courtiol et al. found that the poor survival patches were mainly located in stroma regions and had a pathologist identify their common features.
Patch Clustering
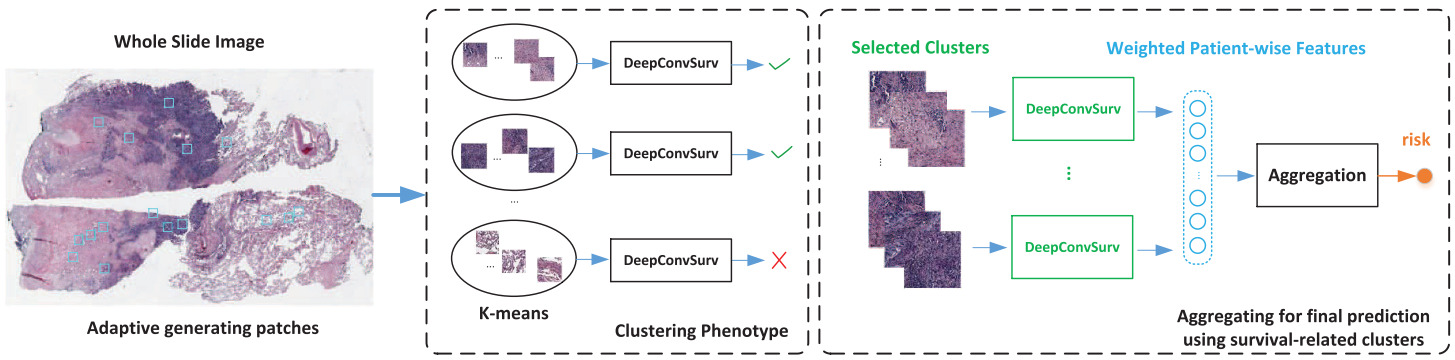
In subsequent work, Zhu et al. clustered image patches across all slides in the training set [Zhu2017]. Then they trained a separate CNN survival model for each cluster. Clusters with little predictive ability were dropped. The features from the remaining cluster models were aggregated across the patches from each cluster. Another survival model then turned the aggregated features into a risk prediction using a linear survival model.
Yue et al. took the same approach with a global clustering of patches and training a survival model for each cluster separately [Yue2019]. Taking only the clusters determined to be discriminative, they computed a normalized histogram of patch predictions and used an SVM to learn the cluster-level predictions.
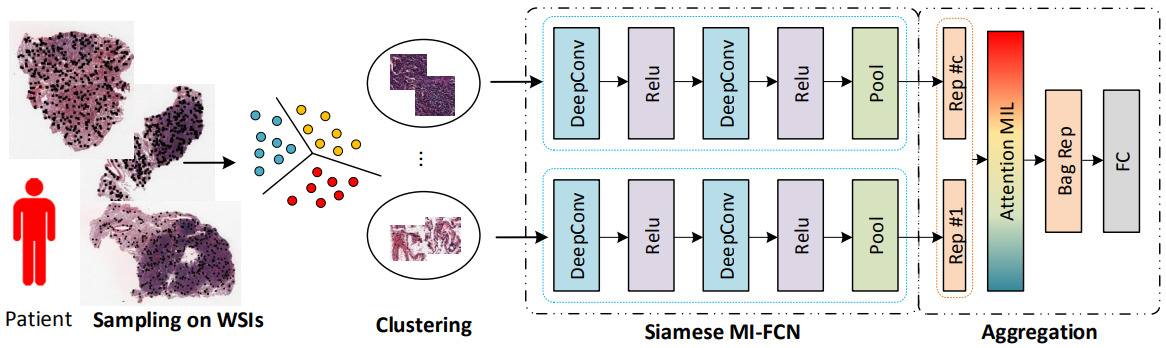
Muhammad et al. learned a global clustering of image patches simultaneously with a survival model that represents each slide with one image patch from each cluster [Muhammad2021]. Yao et al. clustered the image patches for each patient to enable them to select a subset of patches with a diverse appearance [Yao2020].
Clustering image patches can also enable measures of spatial arrangement of tissue. Abbet et al. clustered image patches and calculated feature vectors for each image as cluster probabilities and cluster transition probabilities [Abbet2020]. From these features, they trained a linear survival model. These interpretable features identified tissue interactions associated with poor or better outcomes.
Tissue Segmentation
Other techniques have brought higher-level knowledge into model training – in particular, the tissue types present in the images. Either a pathologist or a machine learning model segments the tissue into a set of classes so that each can be modeled appropriately.
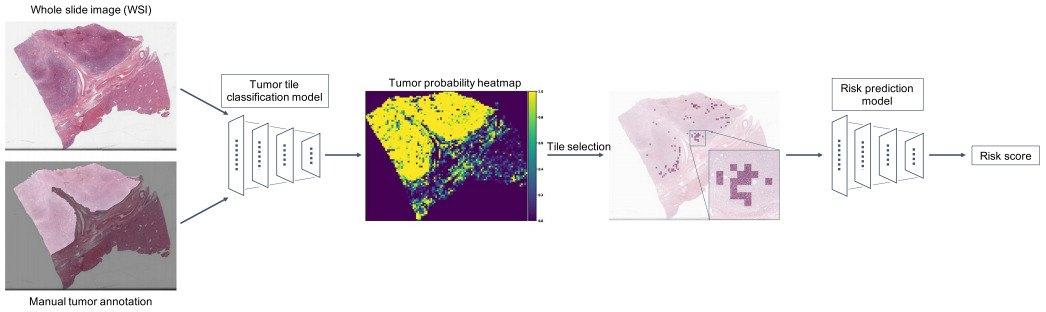
Yamashita et al. classified image patches as tumor or non-tumor and selected the 100 patches most likely to be tumor [Yamashita2021]. Their survival model was then trained on these patches only.
Klimov et al. also trained a CNN model to segment images into tissue classes. Cancer and stroma patches were used to train a CNN to predict metastatic risk [Klimov2021].
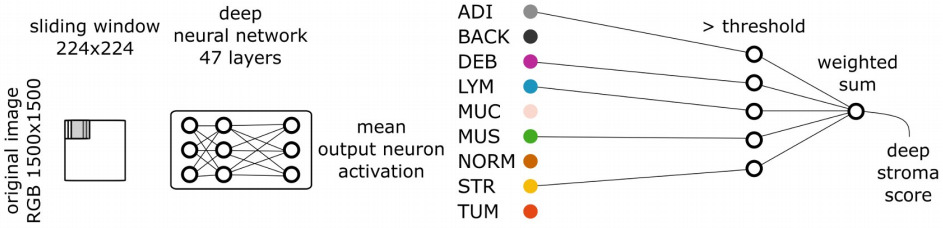
More extensive segmentation tasks have also aided survival prediction. Kather et al. segmented nine tissue types and trained a survival model for each [Kather2019]. They selected those with a high hazard ratio, and weighted them by this ratio when combining CNN features.
Alternatively, the tissue segmentation may be used to compute more interpretable features for survival prediction. Wang et al. identified the area of lymph node and tumor regions, then predicted patient risk from the ratio of the two tissue areas [Wang2021].
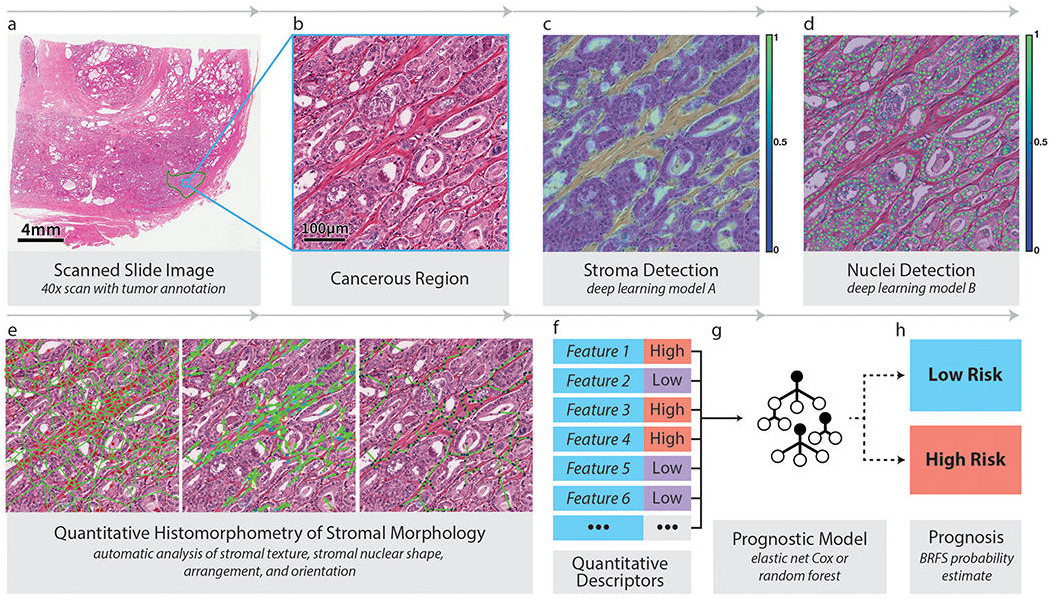
Tissue segmentation can allow a model to focus only on a particular tissue type. Bhargava et al. computed hand-crafted features of intra-tumoral stroma to capture its morphology [Bhargava2020]. Features included stromal texture, connectivity of nuclei, and nuclear shape and orientation. This feature set enabled them to successfully predict outcomes for African-American patients; the features were less predictive of outcome for Caucasian-Americans. Interpretable features were key to understanding their model and emphasized the importance of stroma morphology.
Metrics and Loss Functions
The above section discussed selecting image patches for modeling. The next challenge is creating a model for time-to-event data in which some patients do not have an event observed. It’s not as simple as binary classification. Patients might not have died by the end of the study or they may have been lost to follow up during the study. These observations are known as right-censored.
Let’s define Ti as the time of the event for patient i, and Ei as the event indicator. If Ei is 1, then the event (e.g., death) occurred at time Ti. If Ei is 0, then Ti is the time of last contact with the patient – they are right-censored.
The most common metric used for time-to-event prediction models is concordance index (C-index): the number of concordant pairs divided by the total number of possible evaluation pairs. A concordant pair is when the algorithm correctly predicts that one patient has a greater risk than another.
However, a loss function for deep learning needs to be differentiable for efficient training with a gradient-based optimizer. A standard regression model is not suitable because the right-censored cases would need to be dropped, and a binary classification model (e.g., alive or dead after N years) would not make use of the actual survival times.
Cox Proportional Hazards
The most common method of modeling survival is the Cox Proportional Hazards (CPH) model.
Let’s define the survival function as the proportion of patients surviving at time t:

The instantaneous probability of death at time t is then

The CPH function models the effects of a set of covariates x:

Where λ0(t)is the baseline hazard function and h(x) is the risk function. In a linear CPH model, the risk function is hβ(x)=βTx and can predict the relative risk for a particular patient given these covariates. Training such a model is done by maximizing the likelihood – or, equivalently, the partial log likelihood.
Some of the earlier work applying survival models to histology used hand-crafted features as the covariates. Deep learning models make use of this same formulation by applying a set of non-linear operations to produce the output h(x) for a set of network weights θ.
The first attempts at deep survival models used a small number of features selected by experts to predict heart attack risk from clinical variables and breast cancer risk from gene and protein expression [Katzman2018]. In order to apply this model to histology images, the CPH loss function is placed on top of a CNN.
One downside of the CPH model is that it is not separable. During each iteration of model training, its value is estimated by comparing the relative risk of the patients in the current batch.
Alternative Survival Losses
There are a few alternatives to the CPH loss that still accommodate the right-censored nature of survival data. Meier et al. experimented with the Uno loss, which is based on concordance, and logrank loss that compares right-skewed and censored survival data with a non-parametric test [Meier2020]. They compared with the CPH loss and a 5-year binary classifier. All three risk scores formed better risk heatmaps than the binary classifier. Uno and logrank performed better than CPH quantitatively.
An alternative approach that makes use of both the survival times and the right-censored observations is transforming the data into a multitask model [Li2016, Fotso2018, Vale-Silva2020]. The time axis is divided into intervals and a binary classifier is applied to each to predict whether a patient has survived up to that time point. Typically, some additional constraints are added to ensure the predictions for a particular patient over the time intervals are non-increasing and smooth. Other discrete-time survival models have been proposed for other modalities of data [Gensheimer2019, Zhong2019a].
Wulczyn et al. compared CPH, an exponential lower bound on the C-index, and multitask classification using cross-entropy, finding that the latter performed best [Wulczyn2020]. Muhammad found that combining a CPH loss with a binary classification term produced a better grouping into high and low risk patients than either alone and greatly improved results on a held out test set [Muhammad2021].
Shirazi et al. took a related approach by dividing the time axis into 4 classes: 0-6 months, 6-12 months, 12-24 months, and >24 months [Shirazi2020]. Their model showed great success for glioblastoma but also demonstrated some challenges of training on whole slide images. The survival time for each patient was applied to every patch within the slides. This is one possible solution to the weak supervision problem, but we’ll next look at some alternative methods to training survival models on whole slide images.
From Patches to Slides
Regardless of the chosen loss function and which image patches are selected for modeling, they must be combined into a single risk prediction for the patient. The simplest method is to train a model on image patches independently and average the scores they produce over all patches for each patient. However, models that integrate patch features before the final prediction are often found superior.
This section will outline some weakly supervised learning approaches that have been used with survival models for whole slides. Other weak supervision or multiple instance learning methods could be employed instead. See this article that I wrote about other approaches in this area.
Independent Patches
The simplest approach to whole slide images is to train a model on image patches independently. Meier et al. trained a CNN on 160 x 160 pixel image patches from a tissue microarray, experimenting with both IHC and H&E [Meier2020]. Shirazi et al. also trained on patches independently, but took a majority vote over patch predictions [Shirazi2020].
Patch Feature Aggregation
Instead of aggregating patch predictions, Wulczyn et al. aggregated patch features [Wulczyn2020]. They computed the mean of each feature across all patches for each patient before applying a survival model on top.
Yao et al. first clustered the image patches for each patient, then applied a CNN to each patch and aggregated across the clusters with an attention model [Yao2020]. The self-attention mechanism learns a weight for each feature vector and computes a weighted sum. They applied a fully connected layer on top, followed by the survival model.
As another way to handle multiple patches from the same slide, Bychkov et al. applied a Recurrent Neural Network to CNN features extracted from tissue microarray core image patches [Bychkov2018].
Other Model Extensions
There are also a variety of extensions to the above survival modeling approaches.
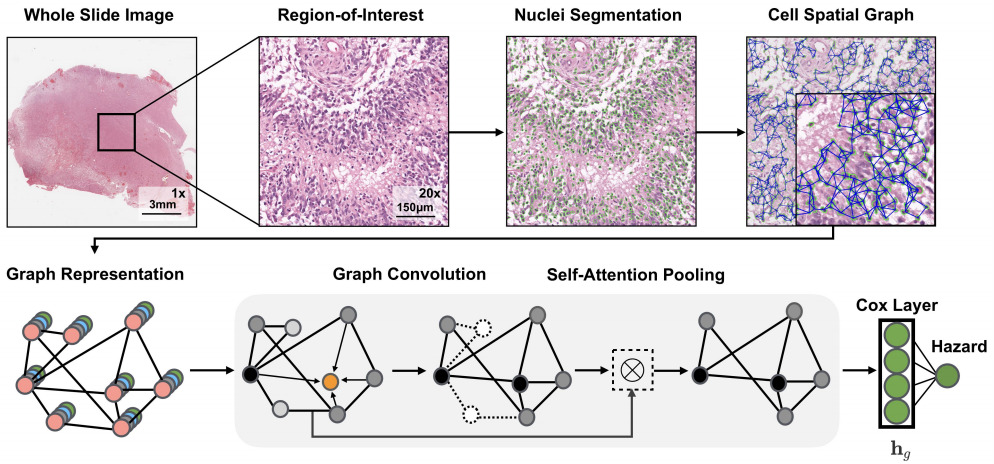
The above applications to whole slide images all use a CNN in some way to model the images. Chen et al. also used a graph convolutional network in which they extracted the topological structure by connecting nuclei to form a graph [Chen2020]. Li et al. modeled tissue topology with a graph CNN [Li2018].
Instead of tissue topology, Lu et al. focused on cellular morphology [Lu2020]. They developed a descriptor of cellular diversity and found it to be predictive of patient outcome.
Multimodal Models
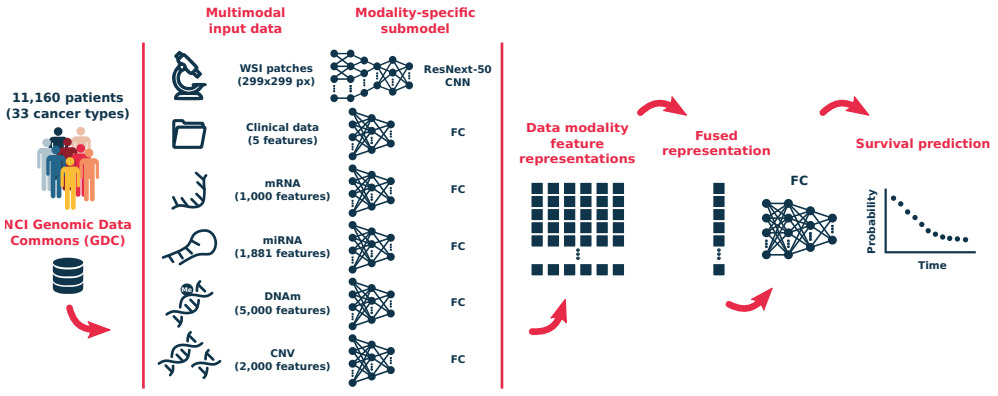
Other modalities like clinical data, genomics, and proteomics can also be used in survival models. Vale-Silva et al. trained a model that fuses a number of modalities of data but found that histology did not improve the model over one that used clinical features only [Vale-Silva2020]. Zhong et al. also studied imaging and gene expression features [Zhong2019b]. They found that, conditional on gene expression, histological features had limited prognostic power; however, their image features were limited to hand-crafted morphology characteristics.
Hao et al. also experimented with a combination of whole slide images and genomic data and found this model superior to one that used only a single modality [Hao2020]. Chen et al. came to a similar conclusion [Chen2020]. They tested multiple modeling strategies: genomic features and whole slides, CNN and graph CNN models on histology.
The consensus seems to be that histology-based features can boost a survival model that uses genomic or clinical variables. However, success may depend on the image features used, the model type, and the dataset, among other factors.
Pan-Cancer Modeling
Survival models have also been applied to multiple types of cancer at once. Wulczyn et al. trained a survival model across 10 cancer types and assessed the predictive power of their model within each cancer type [Wulczyn2020]. Vale-Silva et al. trained a pan-cancer and multimodal model across 33 cancer types [Vale-Silva2020].
Wrap Up and Recommendations
Some of the above approaches used a small CNN trained from scratch. Others applied transfer learning with larger CNN architectures like VGG, ResNet, or GoogLeNet. Given enough training data and computing power, the larger architectures are typically superior.
The modeling approaches discussed above all capture a different perspective of tumor morphology. I don’t yet see a consensus on the best approach. Each one provides different insights into factors affecting patient outcomes.
Modeling patient outcomes from whole slide images is more complex than just weakly supervised learning. Explaining the factors contributing to a good or poor outcome are also critical for advancing our understanding of cancer.
Interpretable models have already revealed some important insights, with disambiguating tissue types being a major key to success. Tissue type area ratios [Wang2021] and connectivity [Abbet2020] influence outcomes. And intra-tumoral stroma morphology may be a stronger predictor of outcome than the tumor itself [Beck2011, Bhargava2020].
Bhargava et al. even showed that a modeling approach that is successful on one population of patients may not be on another [Bhargava2020]. While this identifies an opportunity for a successful survival model, it also demonstrates the importance of evaluating model generalizability.
When developing a new model it will likely be critical to understand what factors have already been associated with outcomes for the type of cancer being studied.
Alternatively, applying a weakly supervised model to whole slide images may discover tissue properties that have not yet been associated with prognostics. But for a successful model to translate into new insights, some means to explainability is essential.
Loss functions that accommodate the right censored nature of survival data out-perform single binary classifiers. However, multitask approaches that incorporate multiple binary classifiers or a survival loss along with a binary one may produce a better risk stratification.
New frontiers in survival modeling include multimodal and pan-cancer methods.
The largest limitation of current models is likely the small amount of training data. As the transition to digital pathology progresses and new collaborations are established, larger training sets will become available. Federated learning can handle datasets located in different centers when data privacy is an issue [Andreux2020].
Prognostic models based on histology images are just beginning to show their potential. But it may require a larger dataset to find the most prognostic patterns in these gigapixel images.
Want to receive regular computer vision insights for pathology delivered straight to your inbox?
Sign up for Computer Vision Insights
References
[Abbet2020] C. Abbet, I. Zlobec, B. Bozorgtabar, J.P. Thiran, Divide-and-Rule: Self-Supervised Learning for Survival Analysis in Colorectal Cancer (2020), International Conference on Medical Image Computing and Computer-Assisted Intervention
[Andreux2020] M. Andreux, A. Manoel, R. Menuet, C. Saillard, C. Simpson, Federated Survival Analysis with Discrete-Time Cox Models (2020), arXiv preprint arXiv:2006.08997
[Beck2011] A.H. Beck, A.R. Sangoi, S. Leung, R.J. Marinelli, T.O. Nielsen, M.J. Van De Vijver, R.B. West, M. Van De Rijn, D. Koller, Systematic analysis of breast cancer morphology uncovers stromal features associated with survival (2011), Science Translational Medicine
[Bhargava2020] H.K. Bhargava, P. Leo, R. Elliott, A. Janowczyk, J. Whitney, S. Gupta, P. Fu, K. Yamoah, F. Khani, B.D. Robinson, T.R. Rebbeck, Computationally derived image signature of stromal morphology is prognostic of prostate cancer recurrence following prostatectomy in African American patients (2020), Clinical Cancer Research
[Bychkov2018] D. Bychkov, N. Linder, R. Turkki, S. Nordling, P.E. Kovanen, C. Verrill, M. Walliander, M. Lundin, C. Haglund, J. Lundin, Deep learning based tissue analysis predicts outcome in colorectal cancer (2018), Scientific Reports
[Chen2020] R.J. Chen, M.Y. Lu, J. Wang, D.F.K. Williamson, S.J. Rodig, N.I. Linderman, F. Mahmood, Pathomic Fusion: An Integrated Framework for Fusing Histopathology and Genomic Features for Cancer Diagnosis and Prognosis (2020), IEEE Transactions on Medical Imaging
[Courtiol2019] P. Courtiol, C. Maussion, M. Moarii, E. Pronier, S. Pilcer, M. Sefta, P. Manceron, S. Toldo, M. Zaslavskiy, N. Le Stang, N. Girard, Deep learning-based classification of mesothelioma improves prediction of patient outcome (2019), Nature Medicine
[Fotso2018] S. Fotso, Deep neural networks for survival analysis based on a multi-task framework (2018), arXiv preprint arXiv:1801.05512
[Gensheimer2019] M.F. Gensheimer, B. Narasimhan, A scalable discrete-time survival model for neural networks (2019), PeerJ
[Hao2020] J. Hao, S.C. Kosaraju, N.Z. Tsaku, D.H. Song, M. Kang, PAGE-Net: Interpretable and Integrative Deep Learning for Survival Analysis Using Histopathological Images and Genomic Data (2020), Biocomputing
[Kather2019] J.N. Kather, J. Krisam, P. Charoentong, T. Luedde, E. Herpel, C.A. Weis, T. Gaiser, A. Marx, N.A. Valous, D. Ferber, L. Jansen, Predicting survival from colorectal cancer histology slides using deep learning: A retrospective multicenter study (2019), PLoS Medicine
[Katzman2018] J.L. Katzman, U. Shaham, A. Cloninger, A. et al, DeepSurv: personalized treatment recommender system using a Cox proportional hazards deep neural network (2018), BMC Medical Research Methodology
[Klimov2021] S. Klimov, Y. Xue, A. Gertych, R. Graham, Y. Jiang, S. Bhattarai, S.J. Pandol, E.A. Rakha, M.D. Reid, R. Aneja, Predicting Metastasis Risk in Pancreatic Neuroendocrine Tumors (PanNET) using Deep Learning Image Analysis (2021), Frontiers in Oncology
[Li2016] Y. Li, J. Wang, J. Ye, C.K. Reddy, A Multi-Task Learning Formulation for Survival Analysis (2016), ACM SIGKDD International Conference on Knowledge Discovery and Data Mining
[Li2018] R. Li, J. Yao, X. Zhu, Y. Li, J. Huang, Graph CNN for Survival Analysis on Whole Slide Pathological Images (2018), International Conference on Medical Image Computing and Computer-Assisted Intervention
[Lu2020] C. Lu, K. Bera, X. Wang, P. Prasanna, J. Xu, A. Janowczyk, N. Beig, M. Yang, P. Fu, J. Lewis, H. Choi, A prognostic model for overall survival of patients with early-stage non-small cell lung cancer: a multicentre, retrospective study (2020), The Lancet Digital Health
[Meier2020] A. Meier, K. Nekolla, L.C. Hewitt, S. Earle, T. Yoshikawa, T. Oshima, Y. Miyagi, R. Huss, G. Schmidt, H.I. Grabsch, Hypothesis‐free deep survival learning applied to the tumour microenvironment in gastric cancer (2020), The Journal of Pathology: Clinical Research
[Muhammad2021] H. Muhammad, C. Xie, C.S. Sigel, M. Doukas, L. Alpert, T.J. Fuchs, EPIC-Survival: End-to-end Part Inferred Clustering for Survival Analysis, Featuring Prognostic Stratification Boosting (2021), arXiv preprint arXiv:2101.11085
[Shirazi2020] A. Z. Zadeh, E. Fornaciari, N.S. Bagherian, et al. DeepSurvNet: deep survival convolutional network for brain cancer survival rate classification based on histopathological images (2020), Medical & Biological Engineering & Computing
[Vale-Silva2020] L. Vale-Silva, K. Rohf, MultiSurv: Long-term cancer survival prediction using multimodal deep learning (2020), medRxiv 2020.08.06.20169698
[Wang2021] X. Wang, Y. Chen, Y. Gao, H. Zhang, Z. Guan, Z. Dong, Y. Zheng, J. Jiang, H. Yang, L. Wang, X. Huang, Predicting gastric cancer outcome from resected lymph node histopathology images using deep learning (2021), Nature Communications
[Wulczyn2020] E. Wulczyn, D.F. Steiner, Z. Xu, A. Sadhwani, H. Wang, I. Flament-Auvigne, C.H. Mermel, P.H. Chen, Y. Liu, M.C. Stumpe, Deep learning-based survival prediction for multiple cancer types using histopathology images (2020), PLoS One
[Yamashita2021] R. Yamashita, J. Long, A. Saleem, D.L. Rubin, J. Shen, Deep learning predicts postsurgical recurrence of hepatocellular carcinoma from digital histopathologic images (2021), Scientific reports
[Yao2020] J. Yao, X. Zhu, J. Jonnagaddala, N. Hawkins, J. Huang, Whole Slide Images based Cancer Survival Prediction using Attention Guided Deep Multiple Instance Learning Networks (2020), Medical Image Analysis
[Yue2019] X. Yue, N. Dimitriou, O. Arandjelovic, Colorectal Cancer Outcome Prediction from H&E Whole Slide Images using Machine Learning and Automatically Inferred Phenotype Profiles (2019), arXiv preprint arXiv:1902.03582
[Zhong2019a] C. Zhong, S. Tibshirani, Survival analysis as a classification problem (2019), arXiv preprint arXiv:1909.11171
[Zhong2019b] T. Zhong, M. Wu, S. Ma, Examination of independent prognostic power of gene expressions and histopathological imaging features in cancer (2019), Cancers
[Zhu2016] X. Zhu, J. Yao, J.Huang, Deep convolutional neural network for survival analysis with pathological images (2016) IEEE International Conference on Bioinformatics and Biomedicine
[Zhu2017] Y. Zhu, J. Yao, F. Zhu, J. Huang, WSISA: Making Survival Prediction from Whole Slide Histopathological Images (2017), IEEE Conference on Computer Vision and Pattern Recognition